Wireshark’s motto is “Go Deep”. It is a network analysis tool and formerly known as Ethereal. It captures packets in real time and displays it in a human-readable format. Wireshark includes color coding, filters, and many other features which will help you dig deep into your network traffic and inspect the individual packets.
Today, we will teach you the basics of capturing packets, filtering them, and Inspecting them through this tutorial. Using Wireshark to inspect a suspicious program and its network traffic. Also analyzing the traffic flow of network, or troubleshooting network problems.
Downloading Wireshark
Wireshark can be downloaded for both Windows and MacOS from their official website. Linux and other UNIX system users can find Wireshark in its package repositories. Example – For Ubuntu user, you will find Wireshark in the Ubuntu Software Center.
A Fair Warning: Wireshark and tools like it are not allowed by many organizations. Using these tools without permission is not suggested.
Capturing Packets
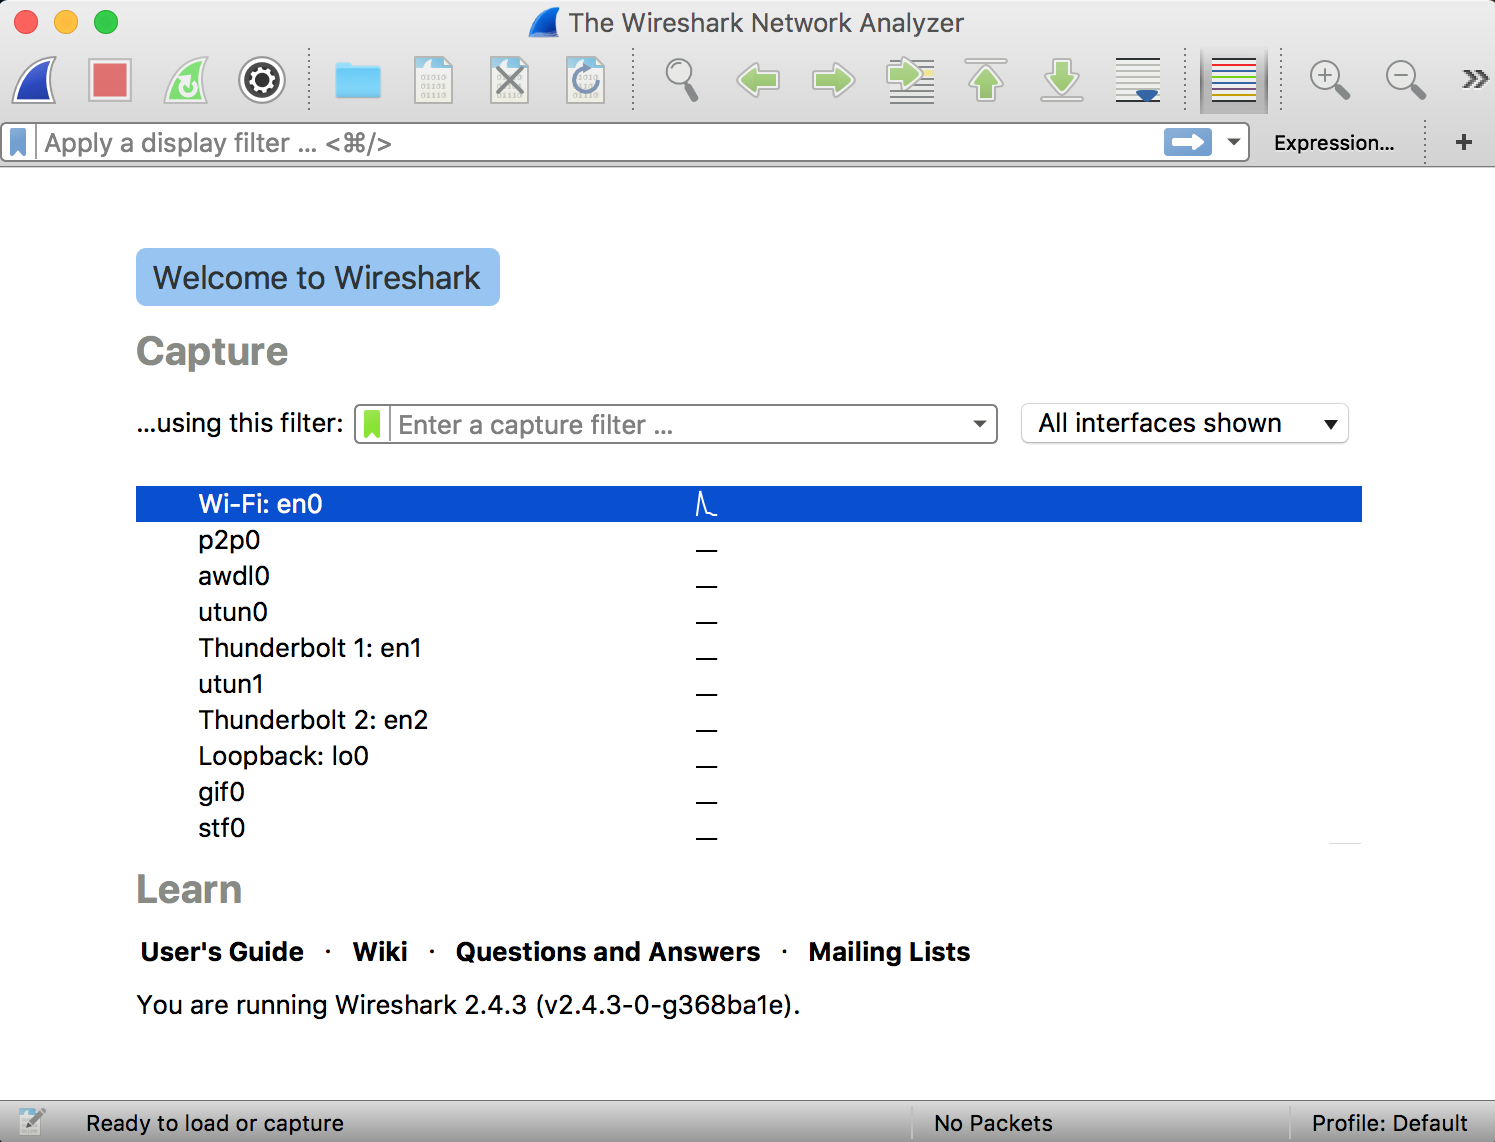
Just download Wireshark and Install it. After the installation process launch it, double-clicking the name of the network interface it will start capturing the packets. Let us take an example. If we want to capture the network traffic on our wireless LAN. Click on the wireless network interface. Advanced options can be configured by going to Capture – Options, this is not required for now.
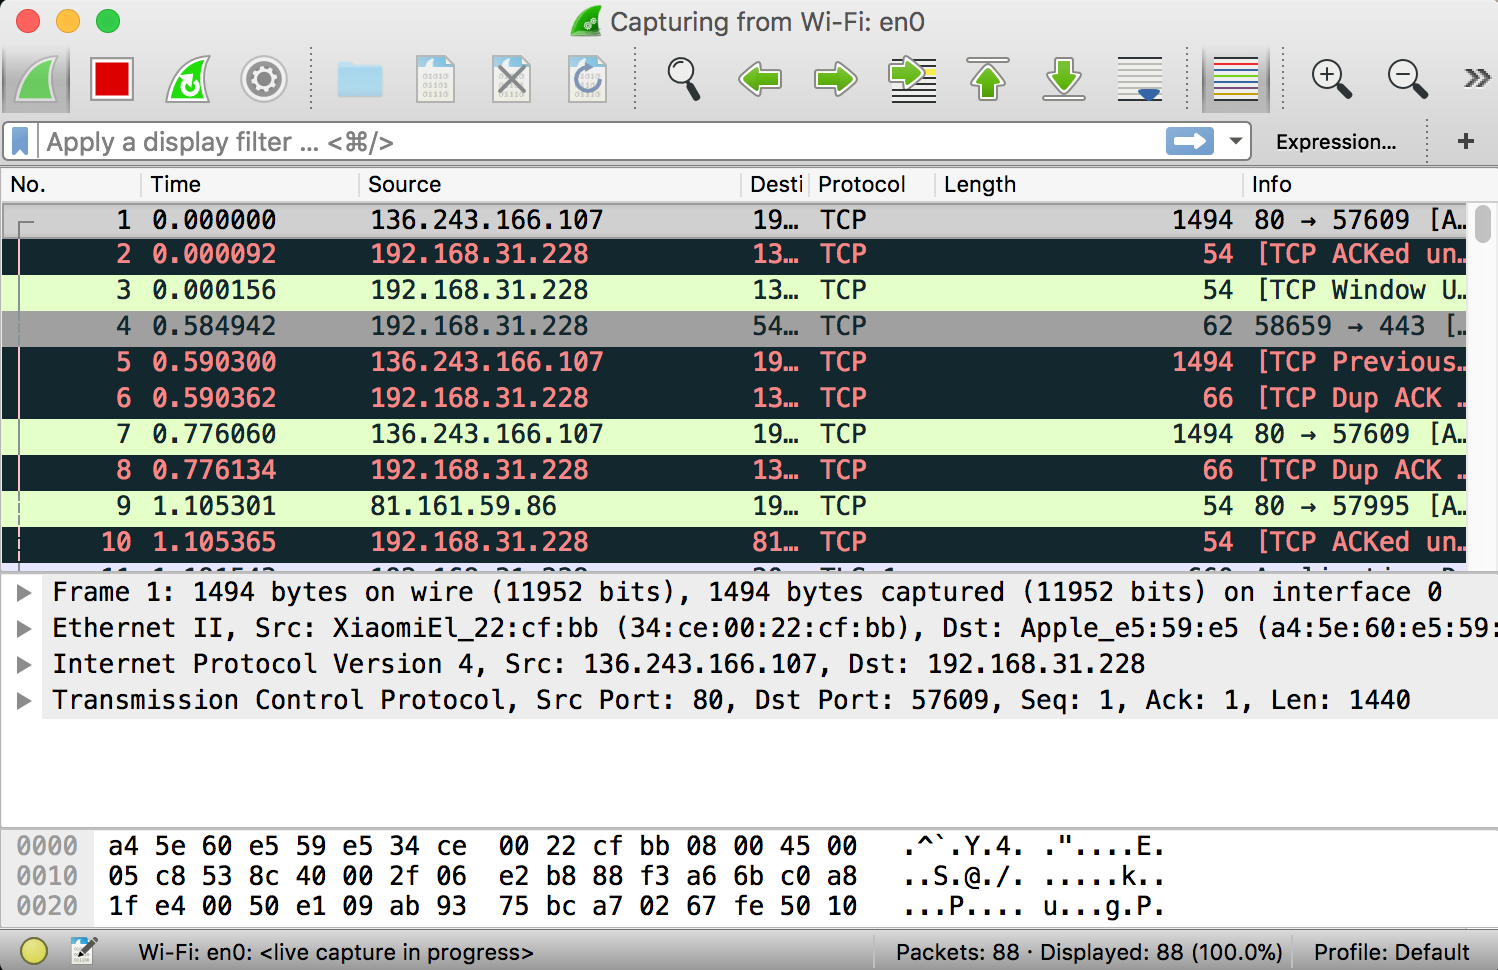
As soon as you single-click on your network interface’s name, you can see how the packets are working in real time. Wireshark will capture all the packets going in and out of our systems.
Promiscuous mode is the mode in which you can see all the packets from other systems on the network and not only the packets send or received from your network adapter. Promiscuous mode is enabled by default. To check if this mode is enabled, go to Capture and Select Options. Under this window check, if the checkbox is selected and activated at the bottom of the window. The checkbox says “Enable promiscuous mode on all interfaces”.
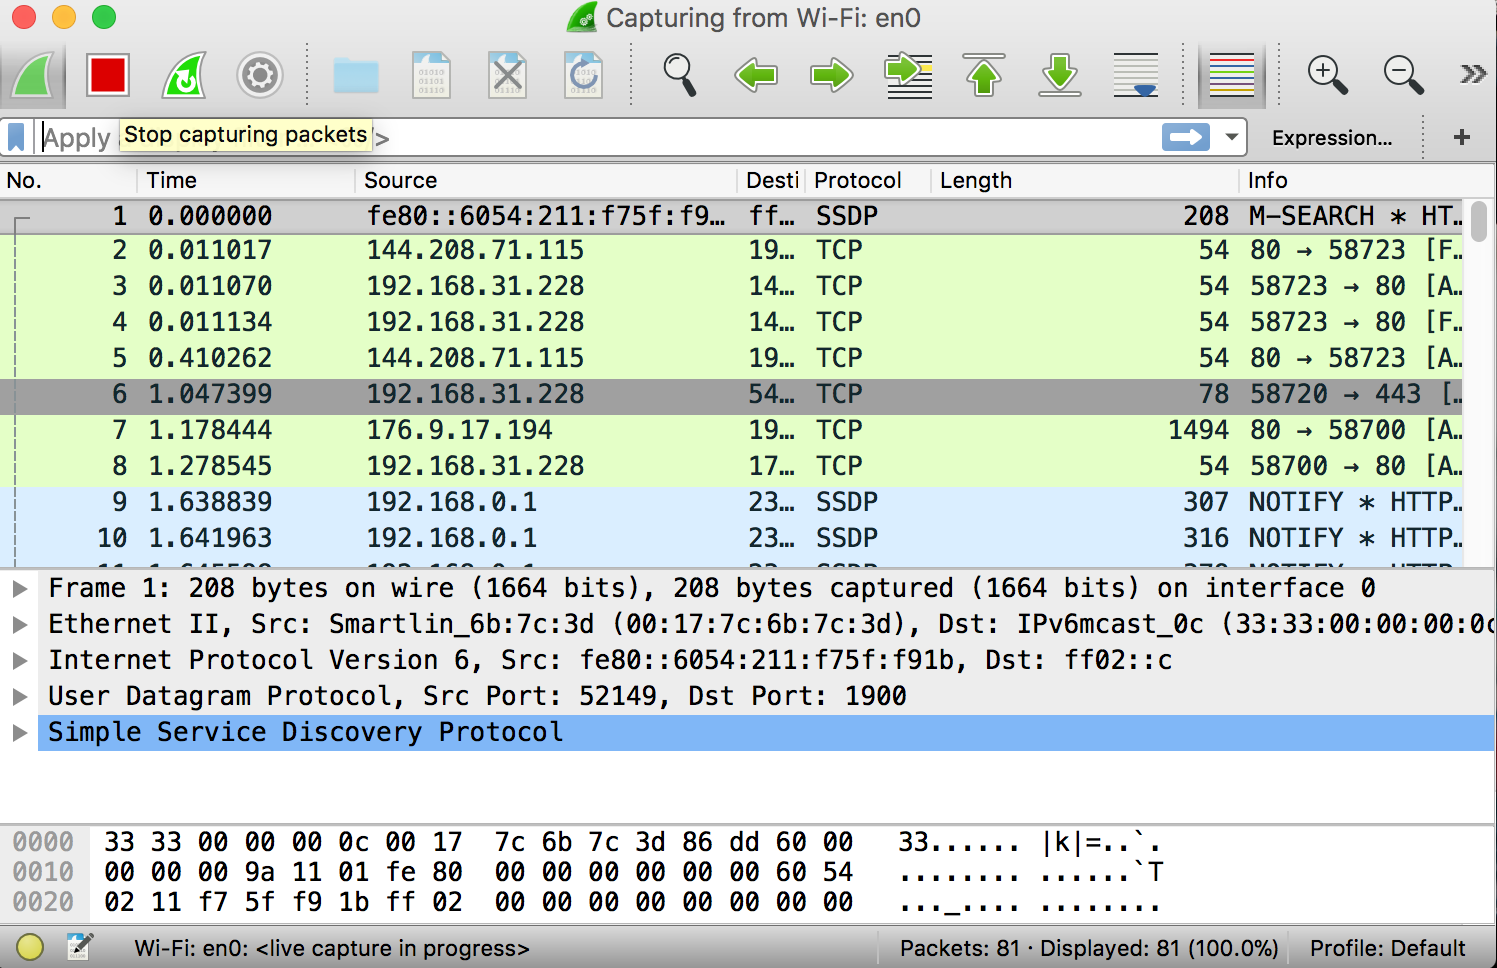
The red box button “STOP” on the top left side of the window can be clicked to stop the capturing of traffic on the network.
Color Coding
Different packets are seen highlighted in various different colors. This is Wireshark’s way of displaying traffic to help you easily identify the types of it. Default colors are:
- Light Purple color for TCP traffic
- Light Blue color for UDP traffic
- Black color identifies packets with errors – example these packets are delivered in an unordered manner.
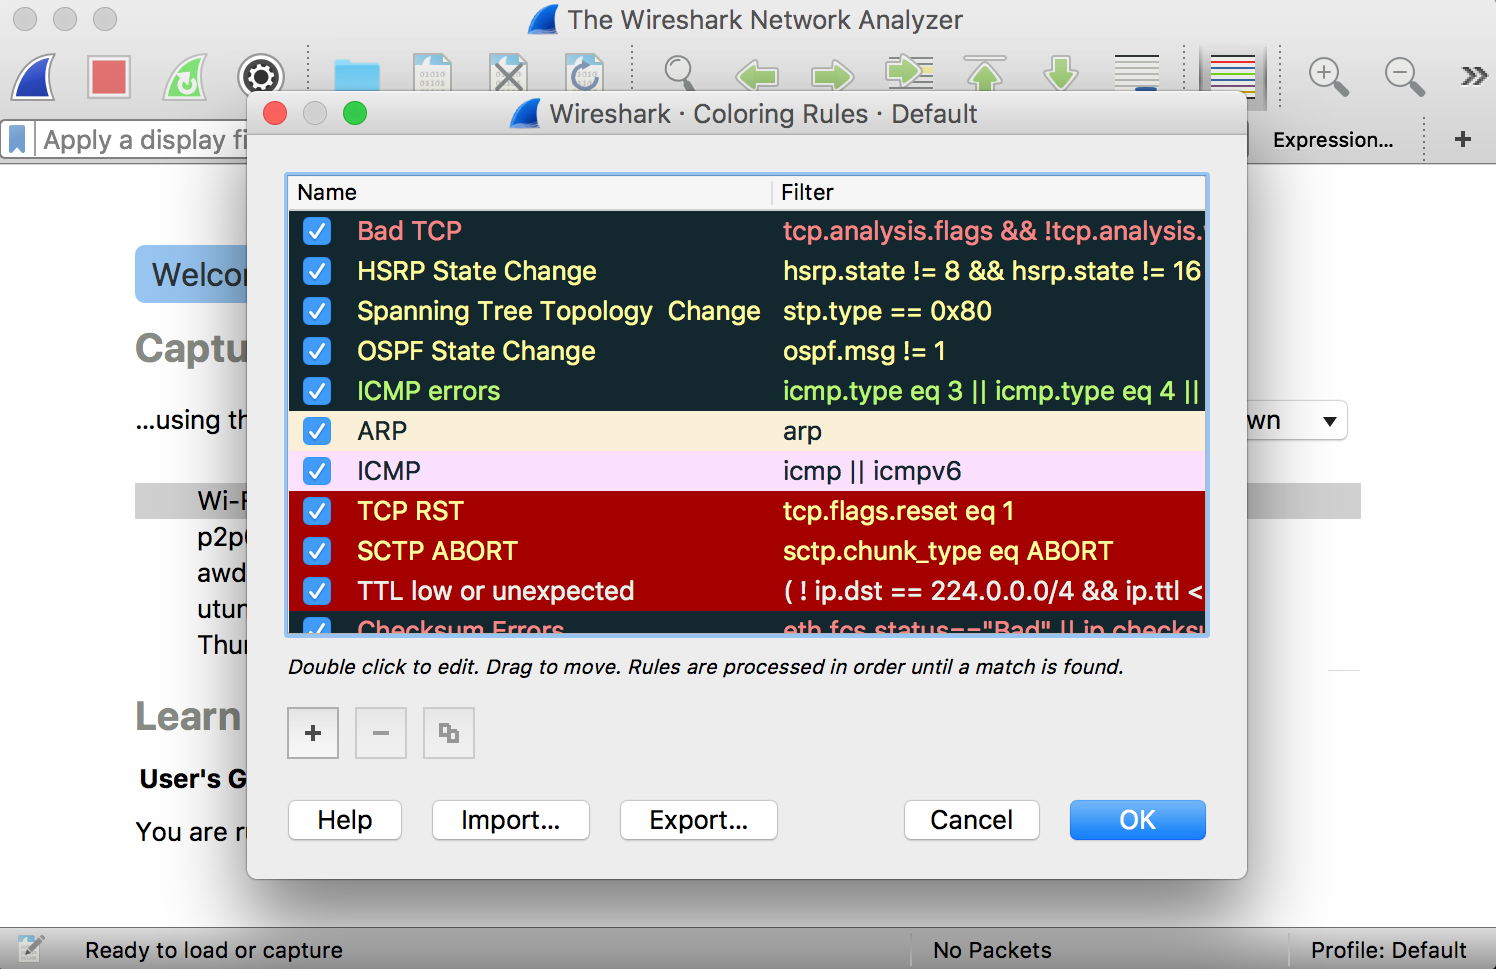
To check the color coding rules click on View and select Coloring Rules. These color coding rules can be customized and modified to fit your needs.
Sample Captures
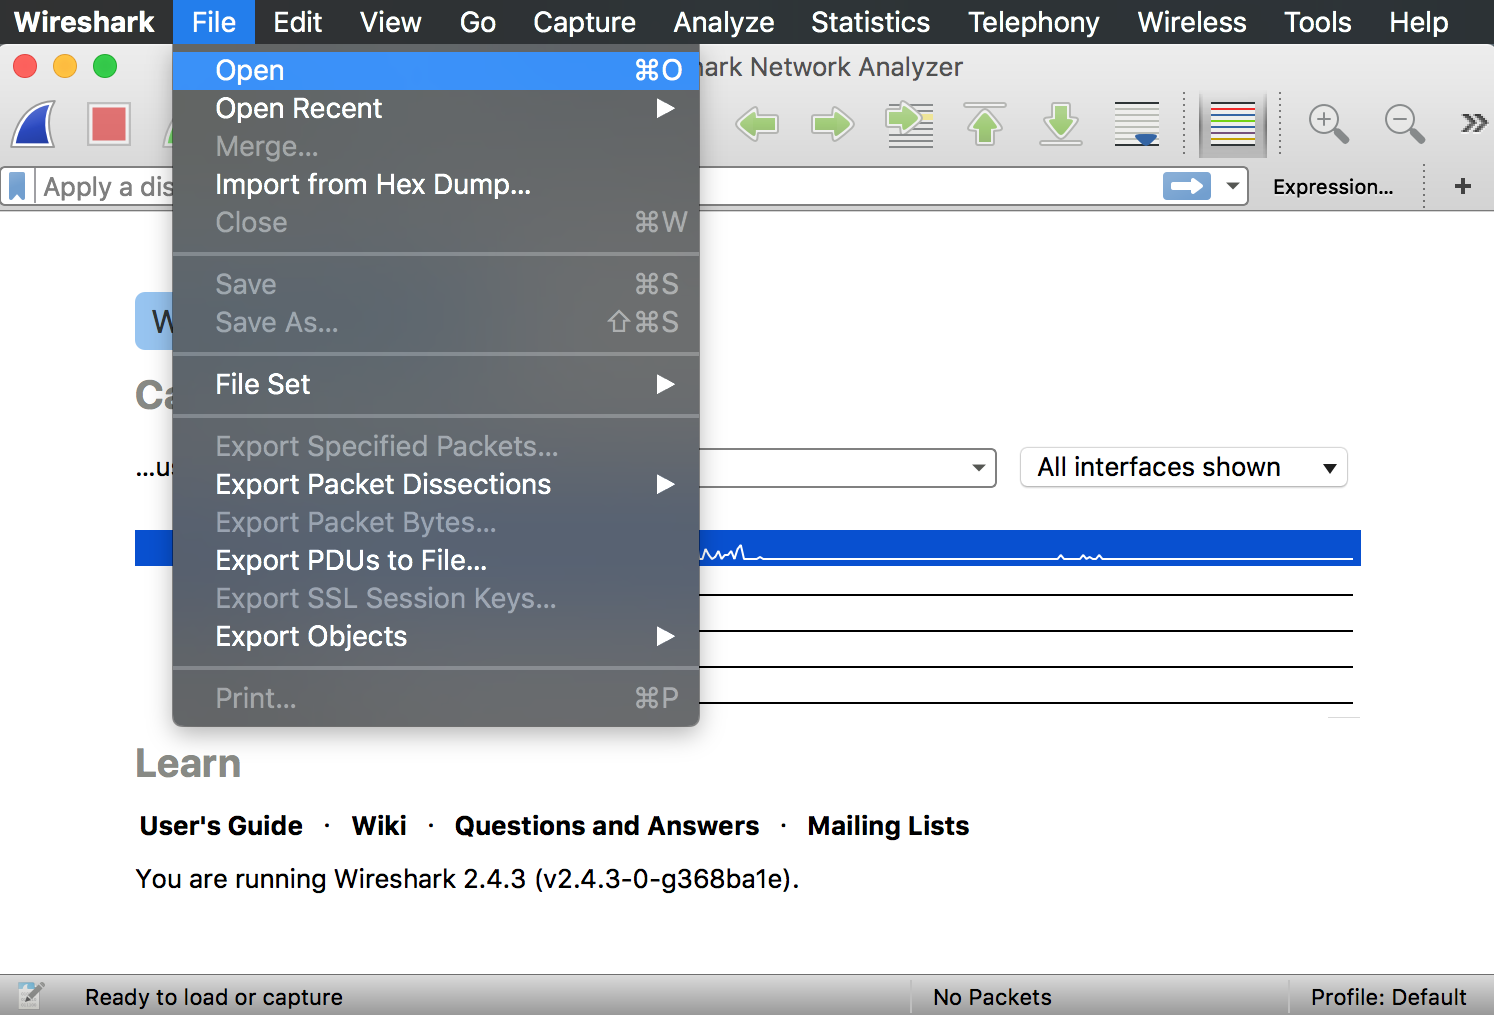
If you find nothing interesting on your own network to inspect. Wireshark’s wiki page has many samples for you. The wiki page has a lot of sample capture files under the page which can be loaded and inspected. To load the file. Click on File then Open in Wireshark. Browse for the downloaded file and select to open it.
Wireshark can also open your own saved captured file. To save your captures, Click on File then select Save.
Filtering Packets
You can inspect some specific data. Example – if you want to inspect traffic which a program sends when calling home. All the other applications using the network can be closed down so that we can specifically narrow the traffic down. Even after this a lot of packets can slip through. Here is when you can use Wireshark’s filters.
So basically, the filters can be applied by punching them in the filter box. Top of the window is where it is located. Once you enter the filer just click on Apply or press Enter. Example – Type “TCP” in the filter box and you will see only TCP packets. Wireshark helps you autocomplete the filter name when you type.
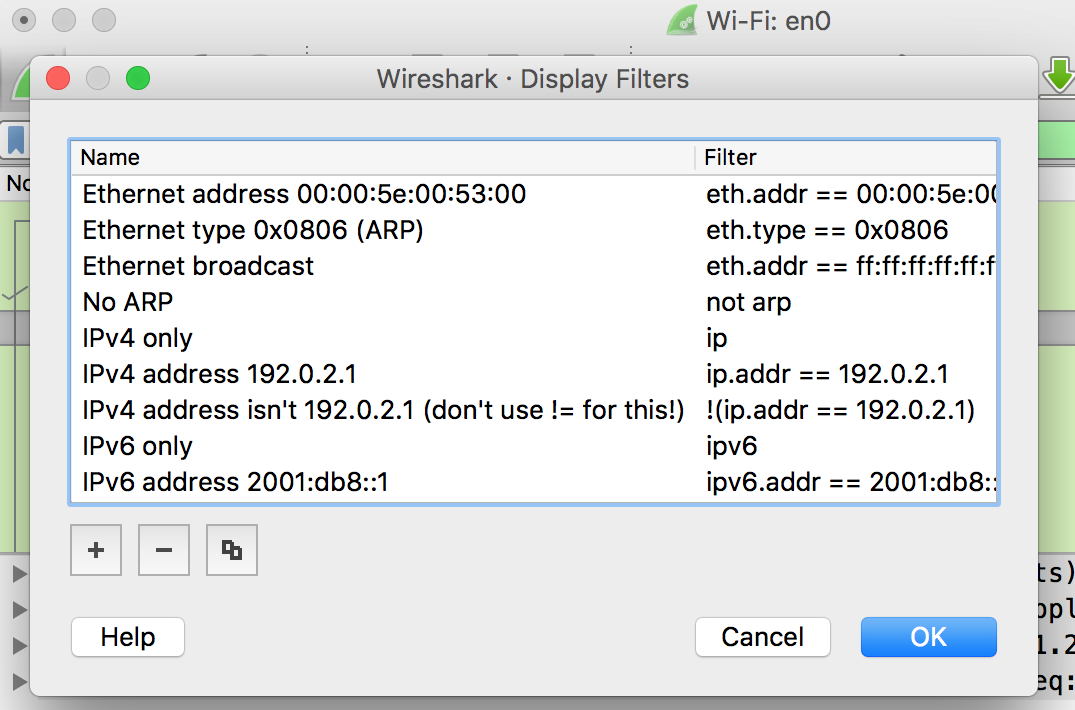
Just click on the Analyze tab and select Display Filters. Wireshark has default filters included which you can choose among from. Furthermore, custom filters of your own can be added and saved to increase the ease of access in future.
More info on Display Filtering Language of Wireshark can be found on their official documentation.
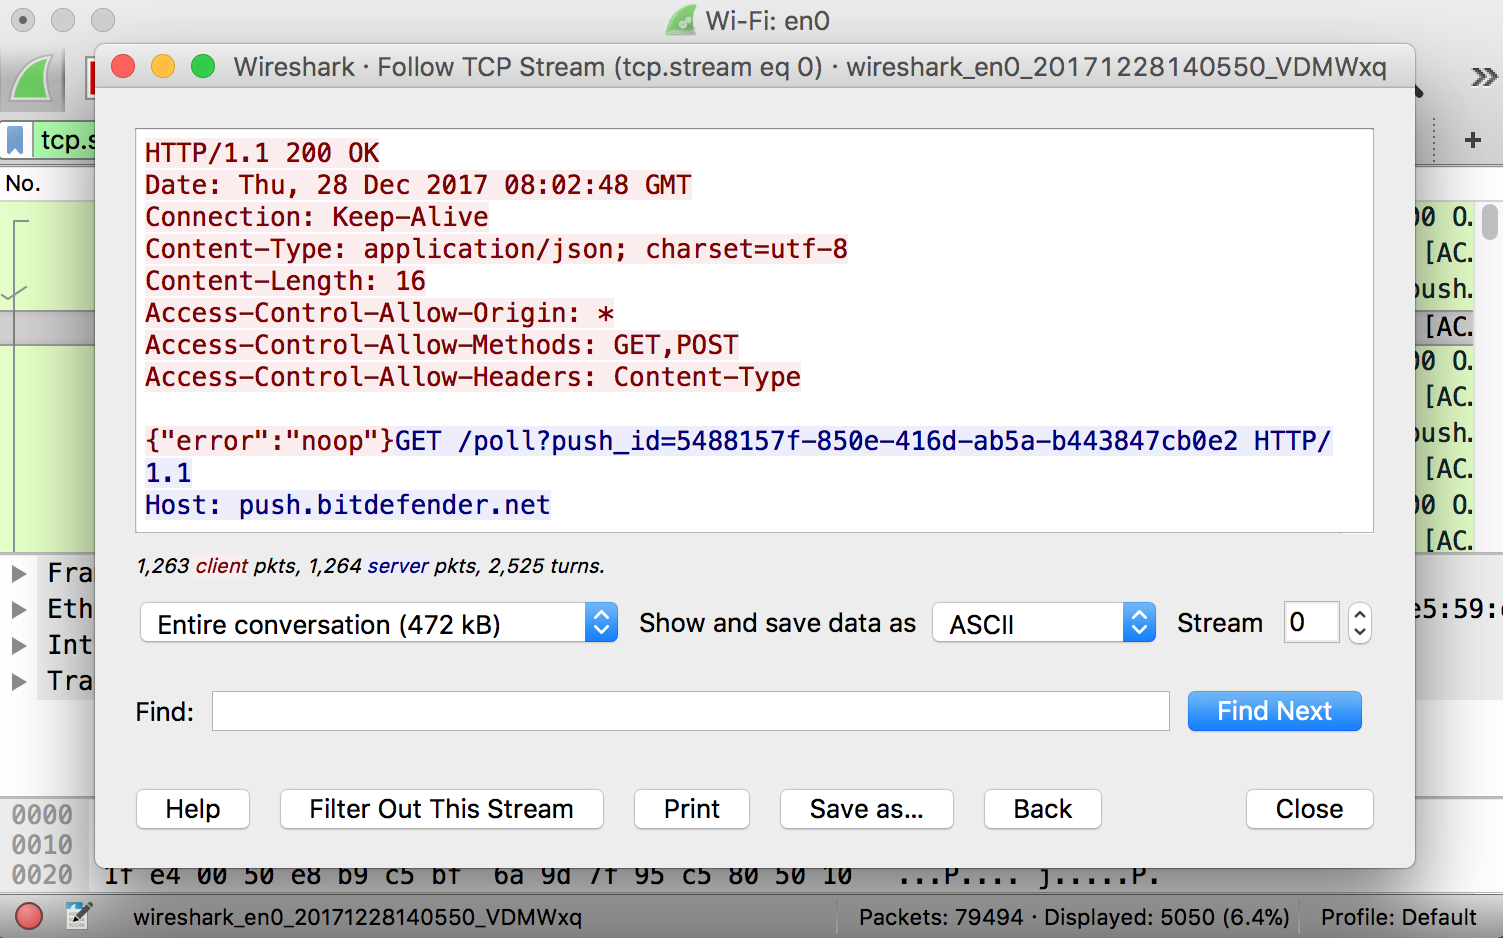
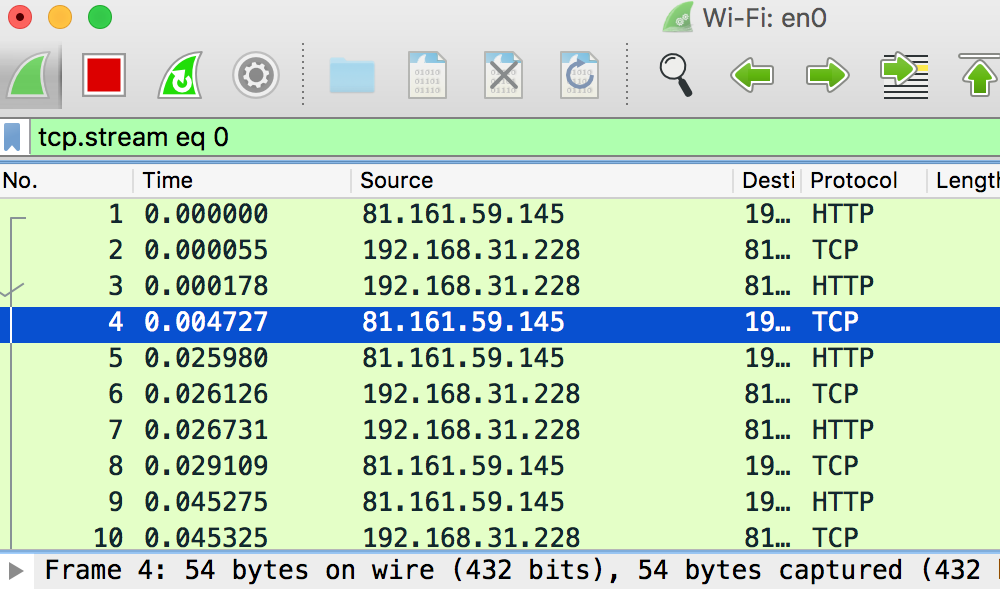
Another thing which might interest you is right-clicking on the packet. Select Follow and then TCP Stream.
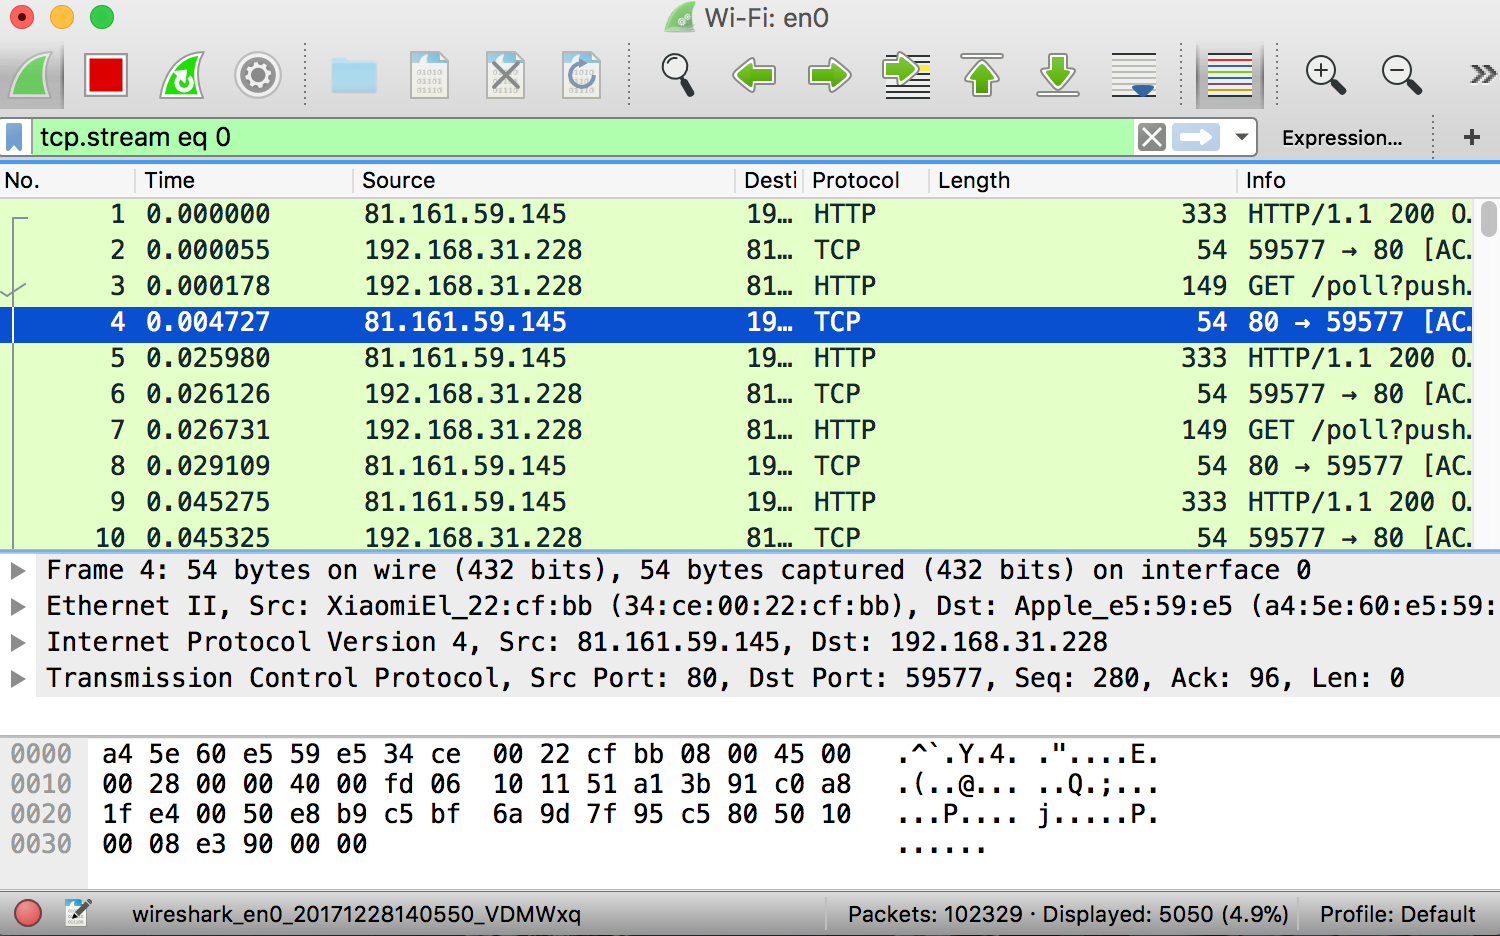
As a result, you will see the whole TCP conversation between both the client and the server. Other protocols can also be viewed by clicking on them under the Follow menu. You can see the whole conversation for other protocols as well, if available.
In addition, closing the above window you will see the filter will be automatically applied. Hence, Wireshark is displaying the packets which are making up the conversation.
Inspecting Packets
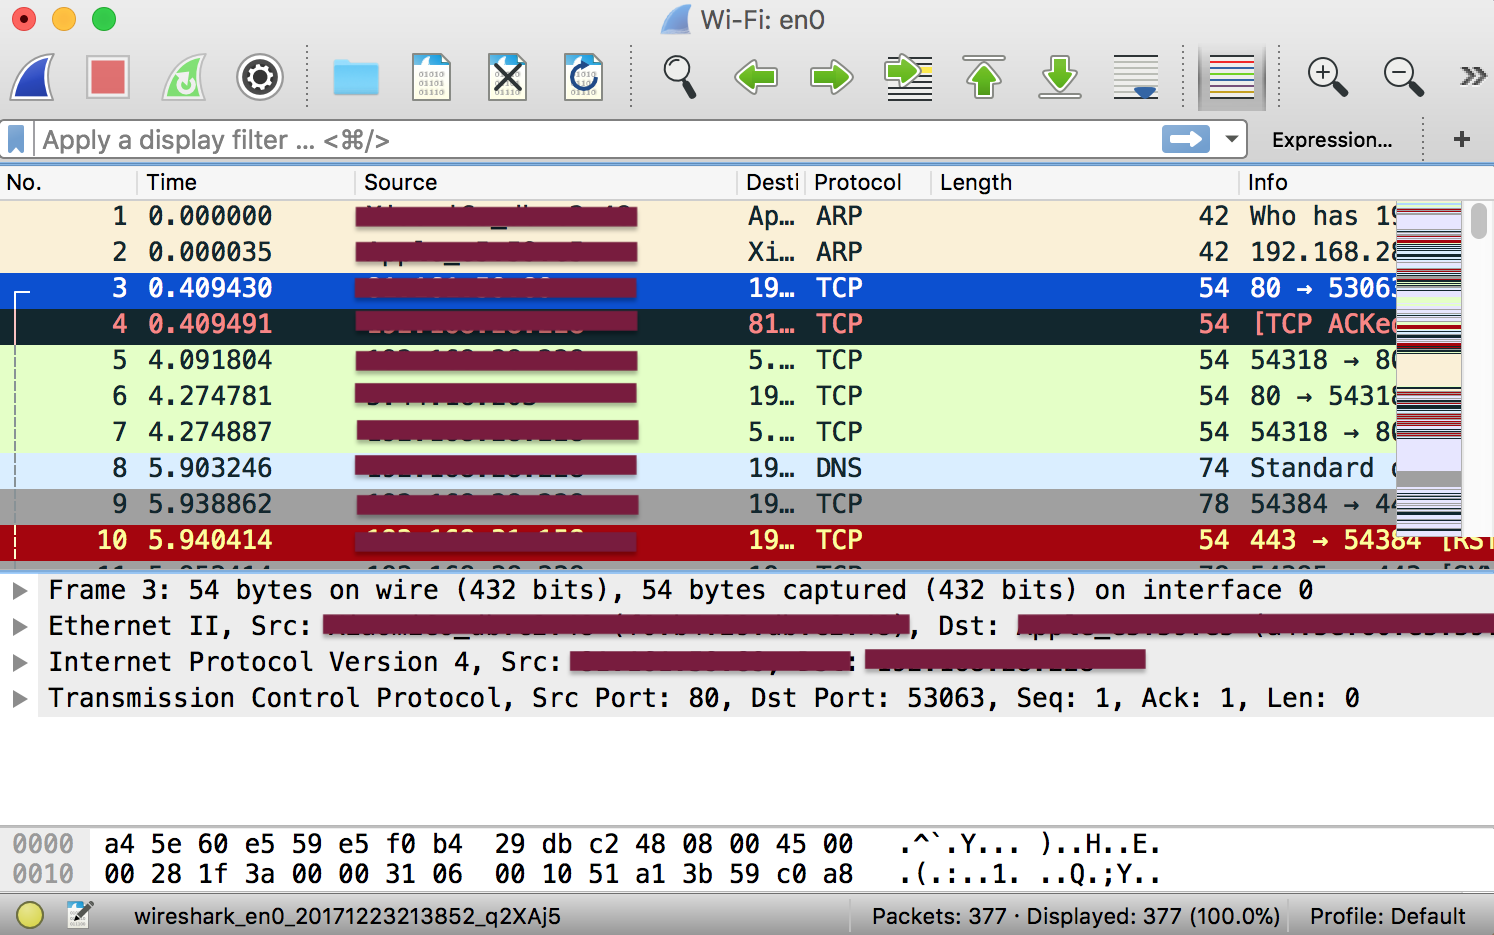
First of all, click on a packet and select it. Now, you can scroll down to view all its details.
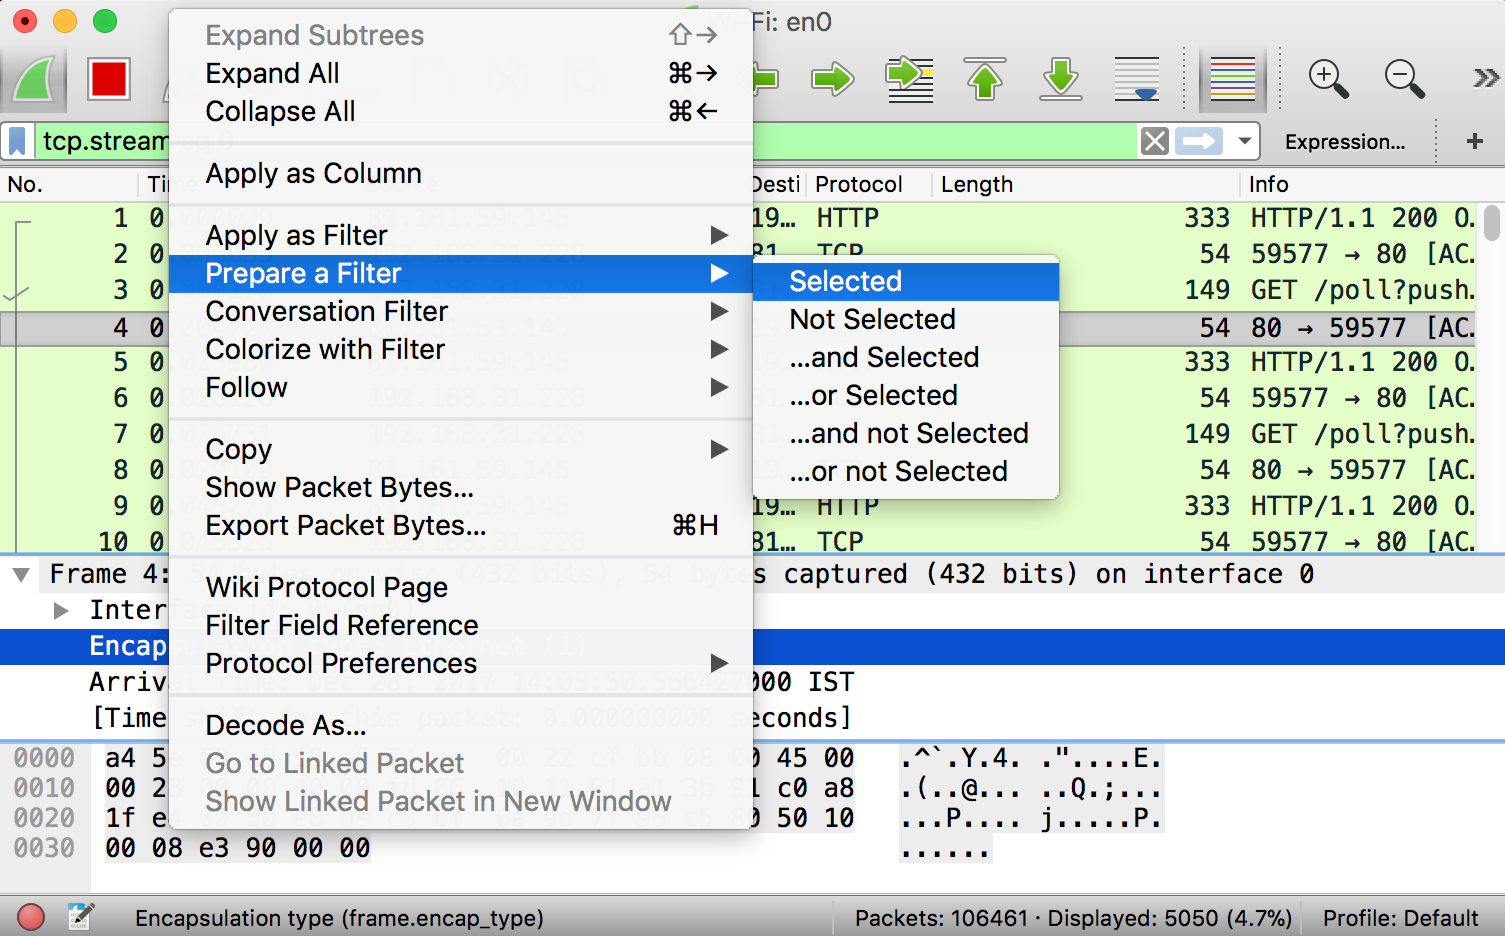
Filters can also be created from here. Right-click on one of any details. From the menu select Apply as Filter drop-down menu so filter based on it can be created.
Hence, Wireshark is a highly powerful tool. And here in this tutorial, we are just explaining some basic functionality of it. Network analyst and professionals use this tools. Since they examine network protocols, inspecting it and examining the security problems.
Also see: 11 Cool Wget Commands to Download Anything from Internet
More information can be found on the official Wireshark User’s Guide. Please check the Wireshark’s website for it.
